
What I Do
How I Can Help
Sales & Revenue Analysis
Turn sales data into a clearer understanding of where revenue is
growing, where profitability is being lost, and where opportunities
may exist.
- Revenue trends
- Loss-making products
- Profitability problems
- Revenue leakage
Customer & Retention Analytics
Analyze customer behavior to identify churn risk, retention patterns,
valuable segments, and revenue that may be at risk.
- Churn analysis
- Customer retention
- Customer segmentation
- Revenue at risk
Product & Growth Analytics
Analyze product usage and experiment data to identify what drives engagement, adoption, and growth — validated through statistical testing rather than assumption.
- Feature adoption
- A/B testing
- Funnel & conversion analysis
- Product engagement
Data Analysis & Reporting
Move from raw data to structured analysis, reporting, and
visualisation that makes business performance easier to understand.
- SQL analysis
- Excel reports
- Tableau dashboards
- Python data pipelines
Portfolio
Featured Case Studies
A selection of projects demonstrating how I apply data analytics to solve Credit Risk, Product, and CRM challenges across Fintech, Mobile Gaming, and Telecom.
SQL
BigQuery
Python
Tableau
Complete
Cookie Cats A/B Test — First-Gate Placement
Decides whether a mobile game's first progression gate should move from level 30 to level 40, using decision rules set before the data was examined. 7-day retention was 0.8 percentage points lower at level 40 (95% interval 0.3 to 1.3 points lower), so the gate stays at level 30. The result held under a bootstrap interval and three sensitivity checks, with the limits of a causal reading stated alongside it.
Fintech
Credit Risk
Analysis
Credit Risk
Analysis
149,999
Borrowers
0.83
Model AUC
55.0%
Peak combined risk
SQL
MySQL
Python
Tableau
Complete
Fintech Credit Risk Analysis
Bureau-independent credit risk segmentation across 149,999 borrowers — SQL, Python behavioural risk scoring and a custom Exposure Index, with a logistic regression scoring AUC 0.83 on held-out data. Borrowers Critical on both risk and exposure defaulted at 55.0%, and placeholder delinquency codes were the strongest single risk signal (54.65%).
Telco
Customer Churn
Analysis
Customer Churn
Analysis
26.54%
Churn rate
£1.67M
Revenue lost to churn
814
High-risk customers
SQL
MySQL
Excel
Complete
Telco Customer Churn Analysis
End-to-end churn analytics project across a three-pillar framework — Customer, Revenue, Risk — built on 22 SQL queries and a four-dashboard Excel reporting suite. Found that 55.5% of churners left in their first year, that churned customers accounted for 30.50% of monthly charges, and isolated an 814-customer profile churning at 69.53%.
Portfolio
Additional Projects
Supporting work that broadens the SQL, Python, and Excel foundation behind the featured projects above.
Superstore
Sales Database
Exploration II
Sales Database
Exploration II
50.8%
Loss-making lines
$14.9M
Total revenue
10
Business questions
SQL
MySQL
Python
Complete
Superstore Sales Database — Exploration II
End-to-end pipeline on a Canadian retail dataset (2009–2012, 8,399 order lines). Designed a normalised MySQL schema, built a Python/SQLAlchemy ETL pipeline from Excel, then answered 10 self-generated business questions with Pandas and Matplotlib. Uncovered that 50.8% of order lines lost money despite $14.9M in total revenue, while Furniture generated $5.18M in sales but only a 2.3% margin.
Quantium
Chip Category &
Trial Store Uplift
Chip Category &
Trial Store Uplift
$1.81M
Chip sales
71,287
Customers
+32.9%
Peak measured uplift
Python
Complete
Quantium Data Analytics — Forage Job Simulation
Cleaned 264,836 transactions to 246,740 chip purchases and merged them with 72,637 loyalty customer records, then built a correlation-based control store matching model to test trial layout uplift. Store 77 showed the largest uplift at +32.9% in sales, backing a client-facing recommendation for Quantium's Category Manager.
Logistics
Operations
Performance Analysis
Operations
Performance Analysis
44.6%
On-time delivery
$5.7M
Maintenance spend
85K+
Trip records
Python
Tableau
Complete
Logistics Operations Performance Analysis
Analysed 85,000+ trip records across 14 tables. Found a 44.6% on-time delivery rate with no driver standing out beyond chance (p = 0.41), and traced an apparent −609% route loss to a faulty fuel join: every route keeps 59–78% of revenue after fuel. Delivered through a Tableau dashboard.
Employee
Performance &
Sales Analysis
Performance &
Sales Analysis
196
Total orders
82%
Supplier risk
6.7×
Workload gap
SQL
MySQL
JOINs
Complete
Employee Performance & Sales Analysis
Evaluates workload balance across employees, customer coverage and supplier geographic concentration. The top three employees processed 51% of orders, the busiest handled 6.7× as many as the least busy, and 82% of same-country supplier pairs are in the USA and Europe.
Northwind
Customer &
Product Analysis
Customer &
Product Analysis
17
Inactive customers
$29
Avg price
5
Priority markets
SQL
MySQL
Complete
Customer & Product Performance Analysis
Evaluates customer concentration risk, pricing imbalance, and revenue dependency within a wholesale distribution environment. Identified 17 inactive accounts representing untapped revenue and pricing outliers skewing the catalog average.
Professional Certification
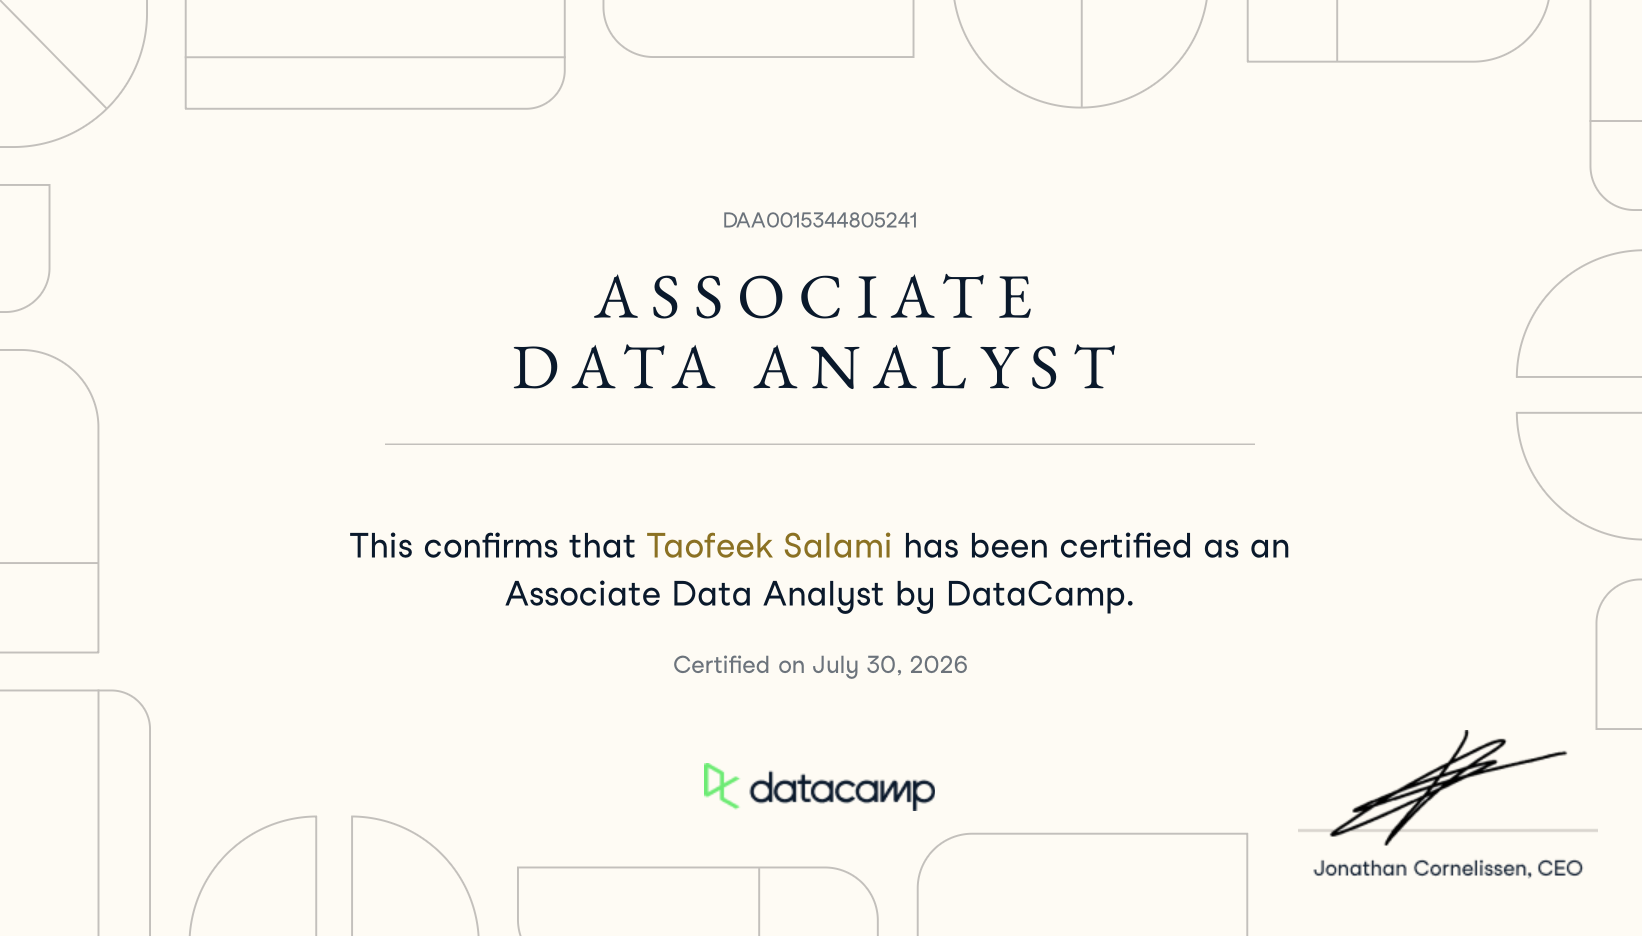
DataCamp — Associate Data Analyst
Associate-Level Certification · Certified Jul 30, 2026
Associate Data Analyst in SQL
Industry-recognised certification from DataCamp confirming
proficiency across the full analytics workflow — data preparation,
exploratory analysis, and statistical reasoning in SQL.
Credential ID DAA0015344805241.
View Credential →
Professional Training
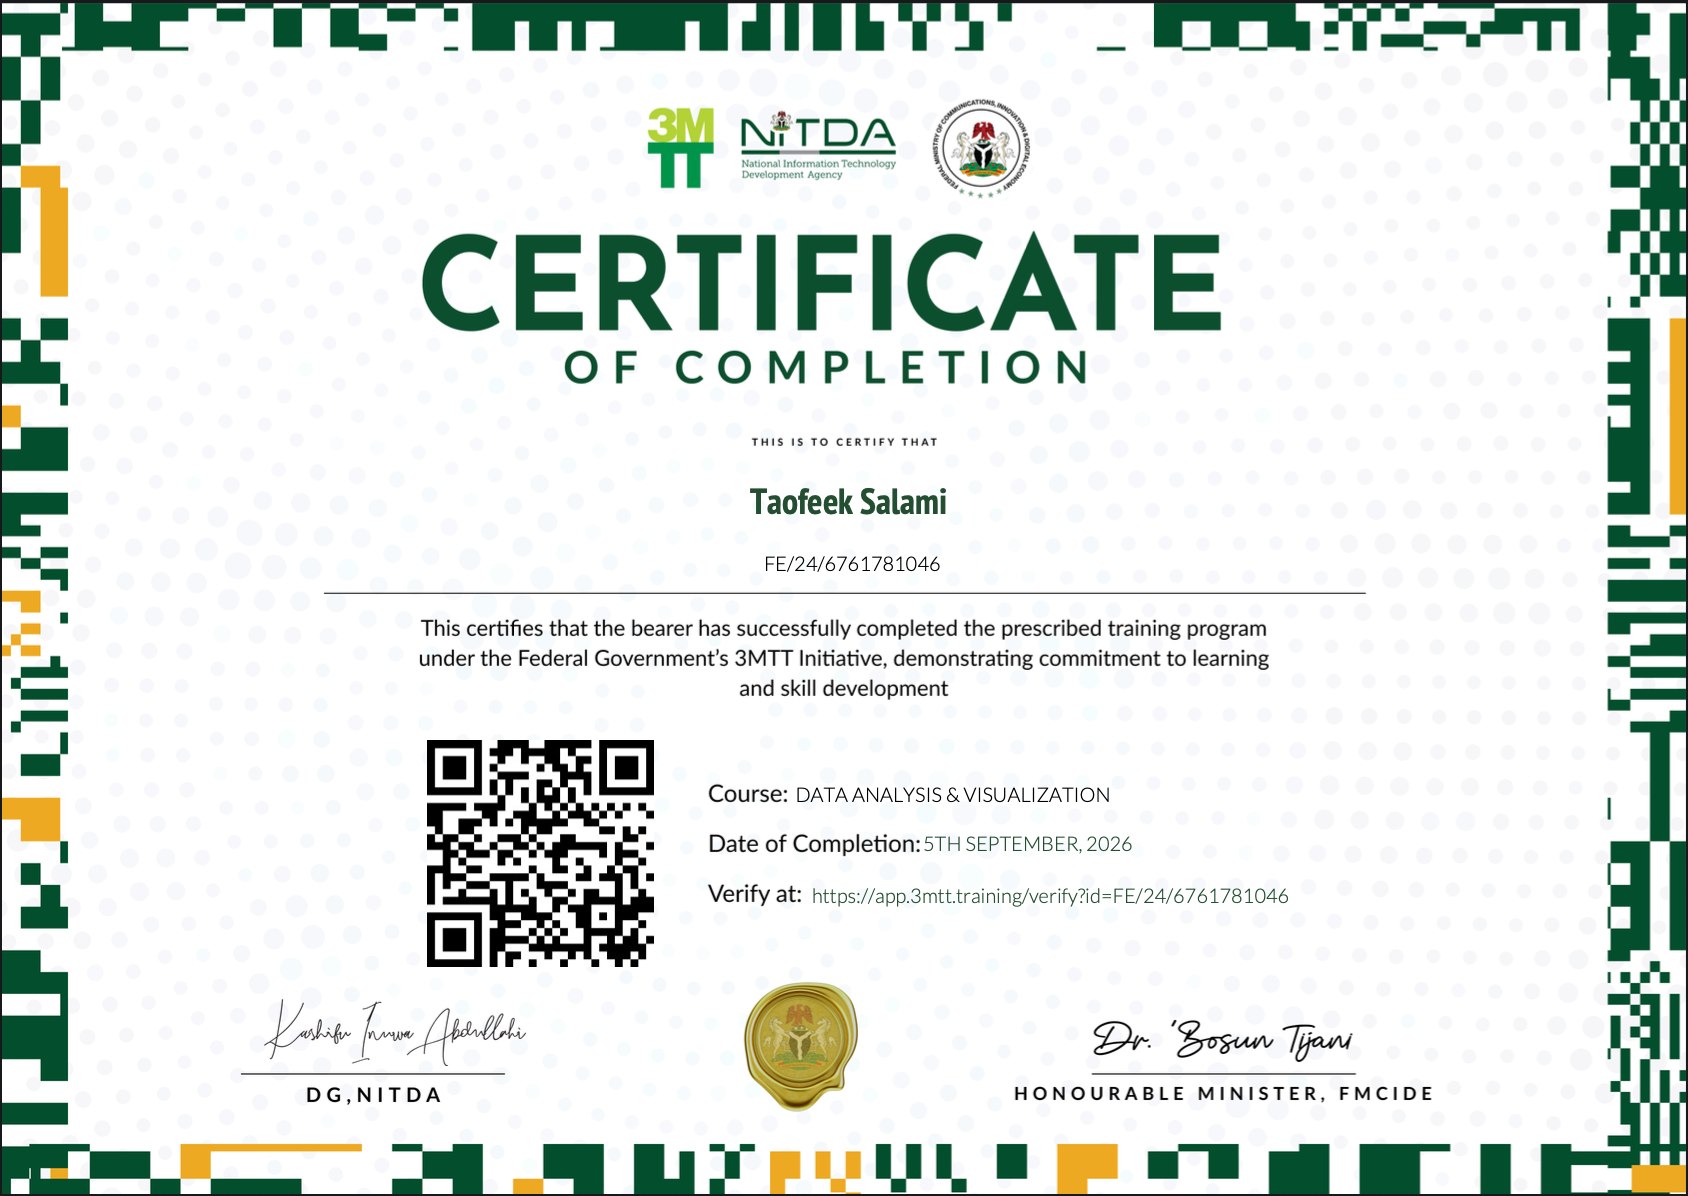
3MTT — Data Analysis & Visualization
Feb – Aug 2026 · Completed Sep 5, 2026
3 Million Technical Talent (3MTT) Programme — NITDA
Completed the Data Analysis & Visualization track of the Federal
Government's 3MTT programme, run by the National Information
Technology Development Agency. The Fintech Credit Risk Analysis was
developed as the programme's capstone project.
Credential ID FE/24/6761781046.
Verify Certificate →
View Capstone Project →
Professional Training
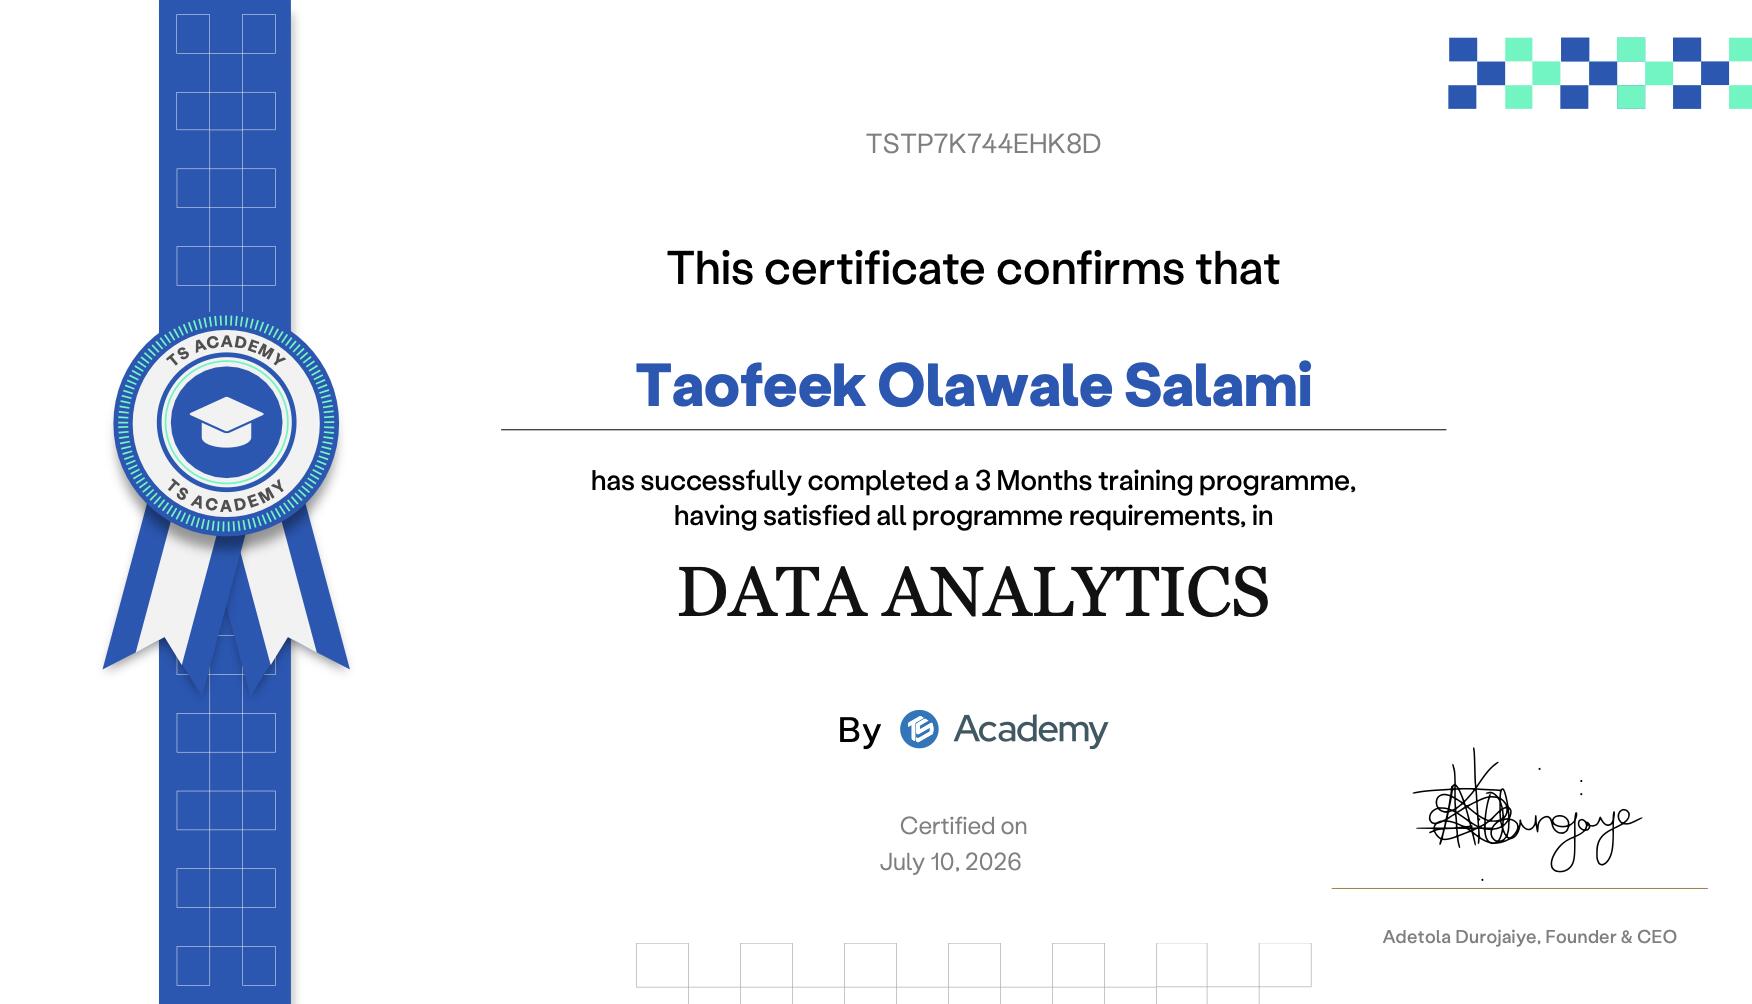
TS Academy — Data Analytics
Completed 3-Month Programme · Certified Jul 10, 2026
Data Analytics Certification Programme
Completed a structured 3-month Data Analytics training programme
covering the full analytics workflow. The Logistics Operations
Performance Analysis was developed and submitted as the programme's
capstone project. Credential ID TSTP7K744EHK8D.
Verify Certificate →
View Capstone Project →
Job Simulations
Forage Virtual Experience Programs
Quantium
Data Analytics — Job Simulation
Jun 2026
BCG
Data for Decision Makers — Job Simulation
May 2026
Deloitte Australia
Data Analytics — Job Simulation
Jun 2026
Certifications
IBM SkillsBuild — 2026
IBM SkillsBuild
Data Visualization and Presentation
Mar 2026
IBM SkillsBuild
Data Preparation for Analysis
Mar 2026
IBM SkillsBuild
Data Collection and Analysis
Mar 2026
IBM SkillsBuild
Introduction to Inferential and Descriptive Statistics
Mar 2026
IBM SkillsBuild
Data Usability for Organizations
Feb 2026
IBM SkillsBuild
Data Classification
Feb 2026
IBM SkillsBuild
Data Fundamentals
Jan 2026