SQL · Python · Tableau · 90,189 Players · Project 9

Cookie Cats
A/B Test
First-Gate Placement

Dataset Kaggle: Mobile Games A/B Testing · 90,189 Players
Tools BigQuery · Python · Tableau
Focus Experiment Analysis · Retention · Decision Rules
Completed Oct 2026

Cookie Cats is a mobile puzzle game in which, according to the dataset description, players meet gates at set levels and must wait or make an in-app purchase to continue. A test assigned 44,700 players to a version with the first gate at level 30 and 45,489 to a version with it at level 40. This project decides whether the gate should move, using a decision rule set before the data was examined, and reports what the result can and cannot show.

SQL BigQuery Python Tableau Complete
Scroll to explore

Keep the First Gate at Level 30

Players in the Test
90,189
44,700 at level 30 · 45,489 at level 40
7-Day Retention, Level 30
19.0%
primary metric
7-Day Retention, Level 40
18.2%
primary metric
Difference
−0.8 pp
95% interval −1.3 to −0.3 · p = 0.002
1-Day Difference
−0.6 pp
not statistically significant
Minimum Detectable Difference
0.85 pp
at 90% power

One Decision, With Its Evidence and Limits

Built in Tableau Public from three aggregated files exported by the analysis notebook, so no player-level data is published. The dashboard reads from top to bottom: the question, the retention figures, the interval the decision is read from, the supporting comparisons, the robustness checks and the caveats.
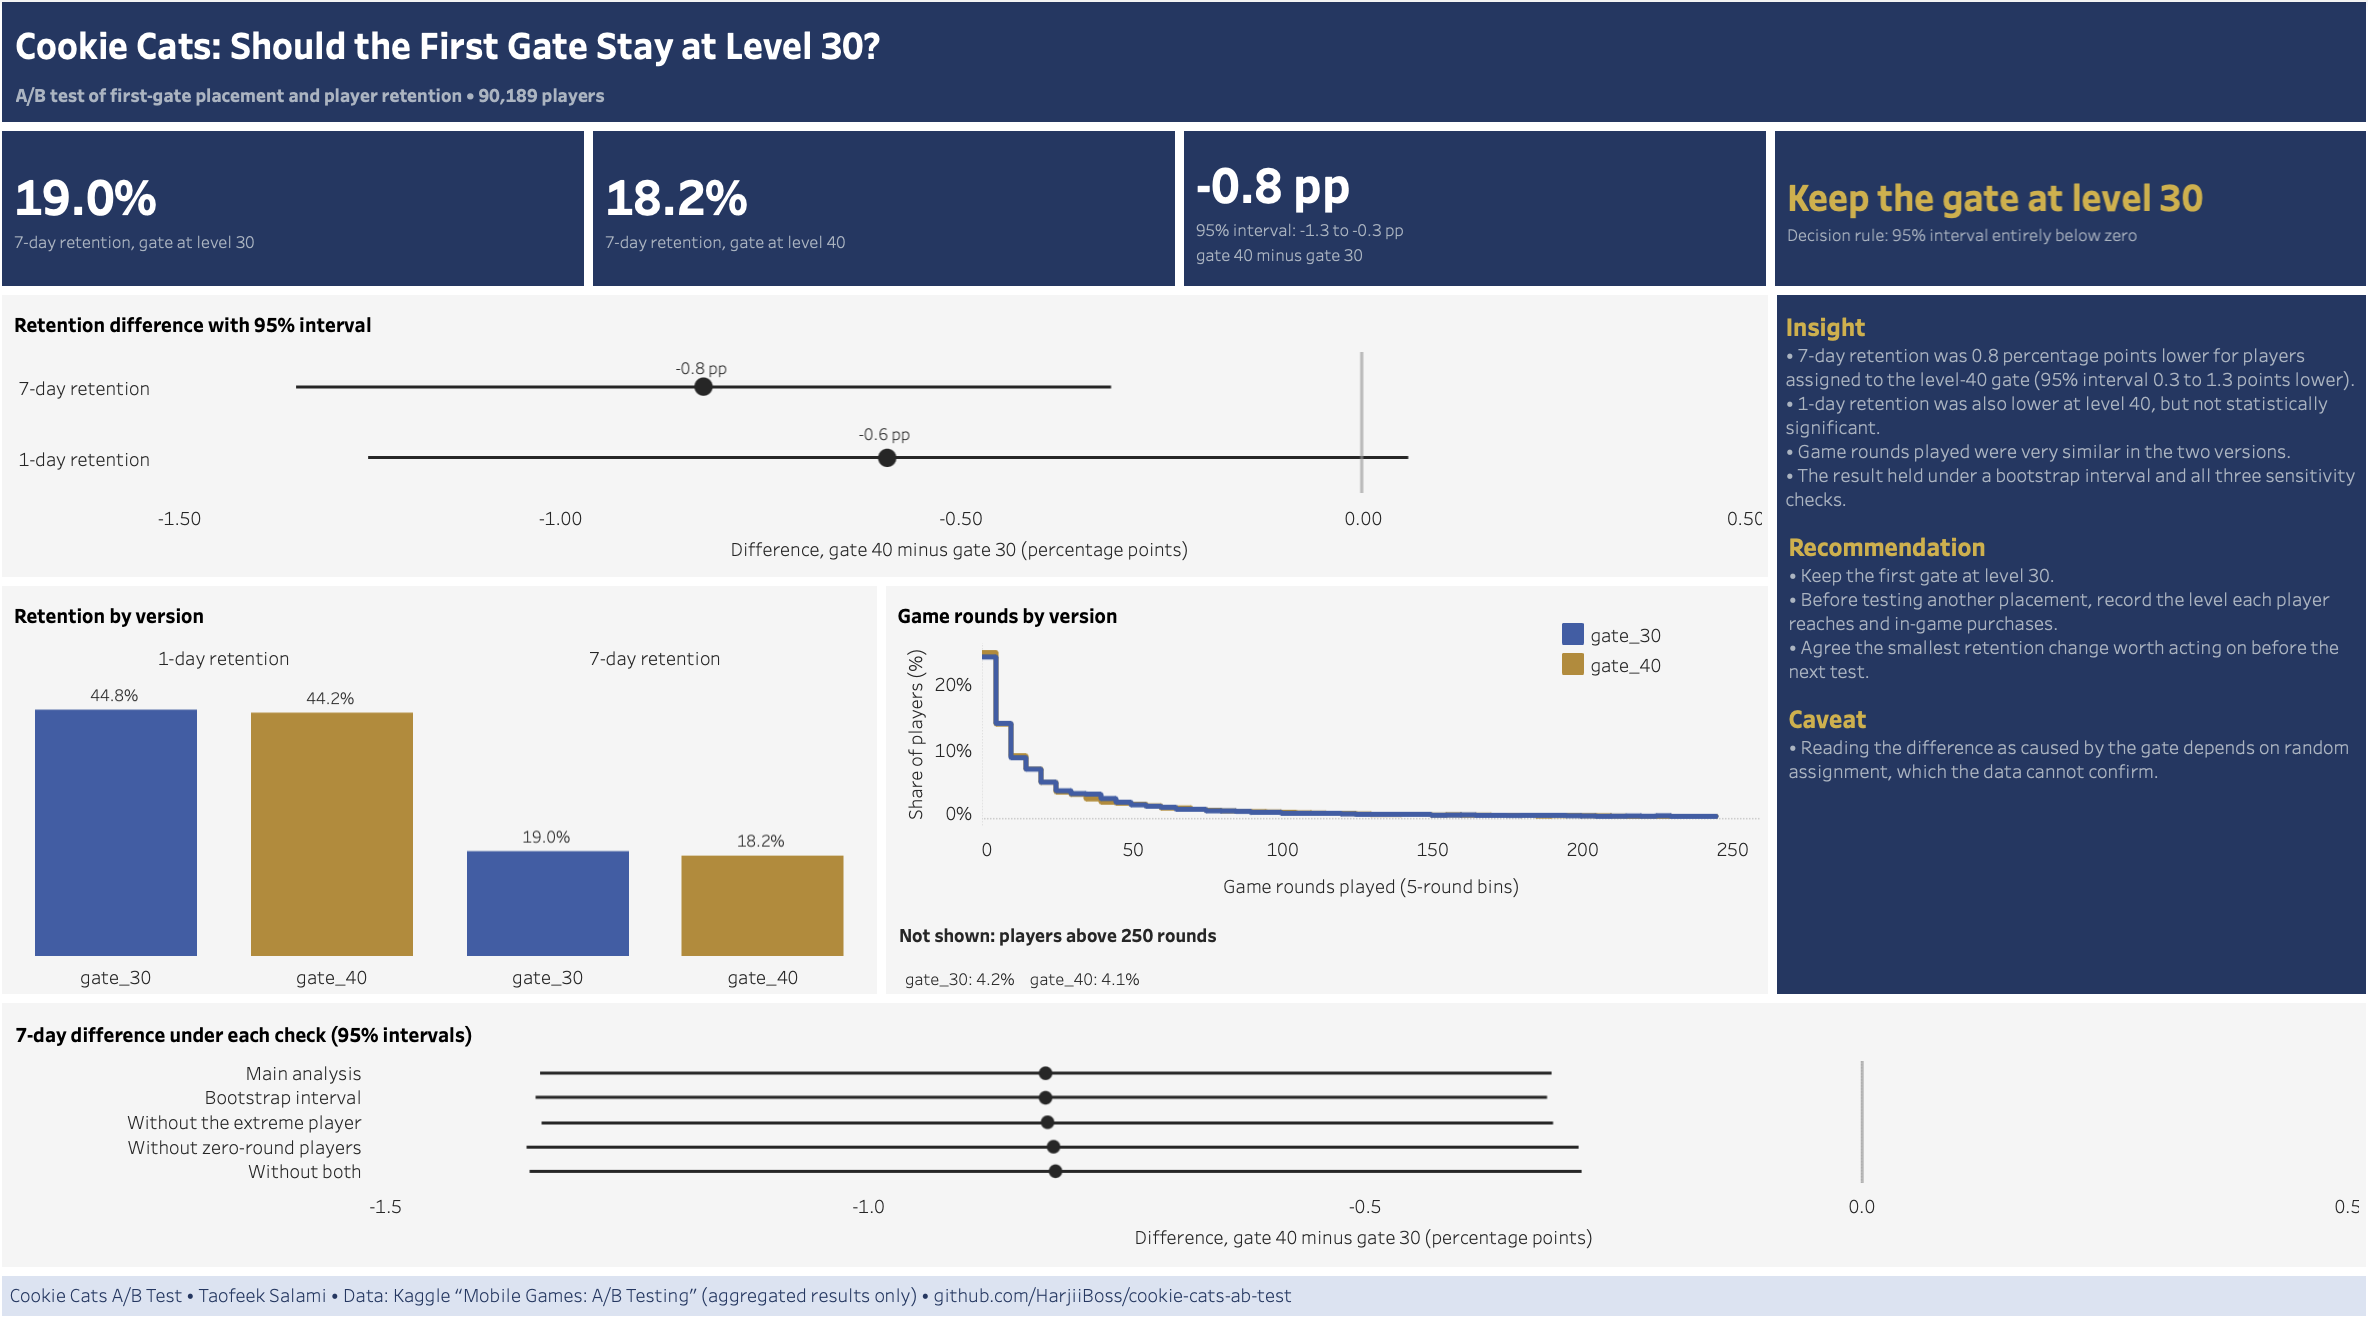
Cookie Cats A/B test dashboard
Should the first gate stay at level 30? Retention by version, the retention difference with its 95% interval, game rounds and robustness checks

What the Test Showed

Primary Metric
7-Day Retention Was Lower With the Gate at Level 40
18.2% of players assigned to the level-40 gate came back to play 7 days after installing, against 19.0% at level 30. The 95% interval for the difference runs from 1.3 to 0.3 percentage points lower, entirely below zero, so the pre-set decision rule gives: keep the gate at level 30.
01
Secondary Metric
1-Day Retention Could Not Separate the Versions
1-day retention was 44.2% at level 40 against 44.8% at level 30. The interval, −1.2 to +0.1 points, includes zero, so the data is consistent with both no difference and a small drop at day 1.
02
Guardrail (Exploratory)
Game Rounds Were Very Similar
Median rounds were 17 at level 30 and 16 at level 40. A randomly chosen level-40 player played more rounds than a randomly chosen level-30 player 49.6% of the time, against 50% if neither version played more.
03
Robustness
The Result Held Under Four Further Checks
The 7-day interval stayed below zero with a bootstrap interval, and when the one player with 49,854 rounds, the players with no rounds, or both were left out.
04
What the Data Cannot Show

Reading the difference as caused by the gate depends on random assignment, which the dataset does not document; the sample ratio test raised no alert (p = 0.009 against an alert level of 0.001) but cannot prove it. The observed difference is close to the smallest this test could reliably detect, so the full interval is a safer summary than the single figure. The data has no revenue, purchase or level information, so the commercial value of the difference is not estimated.

What the Product Team Should Do

01
Decision
Keep the First Gate at Level 30
If the difference is caused by the gate position, keeping it at level 30 means roughly 300 to 1,300 more players coming back on day 7 for every 100,000 new players.
02
Data Collection
Record Progression and Purchases Before the Next Test
Logging whether and when players reach the gate, alongside in-game purchases, would allow the next test to measure effects on revenue and on players who actually meet the gate.
03
Test Design
Agree the Smallest Worthwhile Change in Advance
This test used zero as its threshold, so it settles direction, not business size. Setting a minimum effect worth acting on lets the next result be judged on both.

6-Phase End-to-End Workflow

Phase 0
Scoping & Decision Rules
Set the business question, metrics, hypotheses and decision rules before the data was examined, including what each possible interval would mean for the gate.
Phase 1
Loading & Cleaning
Loaded the data into BigQuery and confirmed one row per player, no player in both versions and no missing or invalid values. Kept every player and flagged the extreme value for the sensitivity checks.
Phase 2
Business Analysis
Ran a sample ratio test before comparing outcomes, then described retention, retention patterns and game rounds by version in SQL.
Phase 3
Method Selection
Chose a two-proportion z-test with a 95% interval, fixed-sequence testing for the secondary metric, Mann–Whitney U for game rounds, and a power calculation for the minimum detectable difference.
Phase 4
Statistical Testing
Ran the tests in Python, checked library results by manual calculation, and reported a bootstrap interval and sensitivity checks whatever their result.
Phase 5
Reporting & Publication
Wrote the executive summary and built the Tableau dashboard. Before publishing, re-ran every notebook from a clean kernel; the dashboard data reproduced exactly.
↗
Full Project Repository
Cookie Cats A/B Test — GitHub
Repository contains the BigQuery SQL scripts, four Python notebooks, the packaged Tableau workbook, the executive summary and phase-by-phase documentation including the decision rules, assumption register and data dictionary.
View Repository →